
MobiVision Epigenomics - ATAC-seq Results Interpretation
Output Files
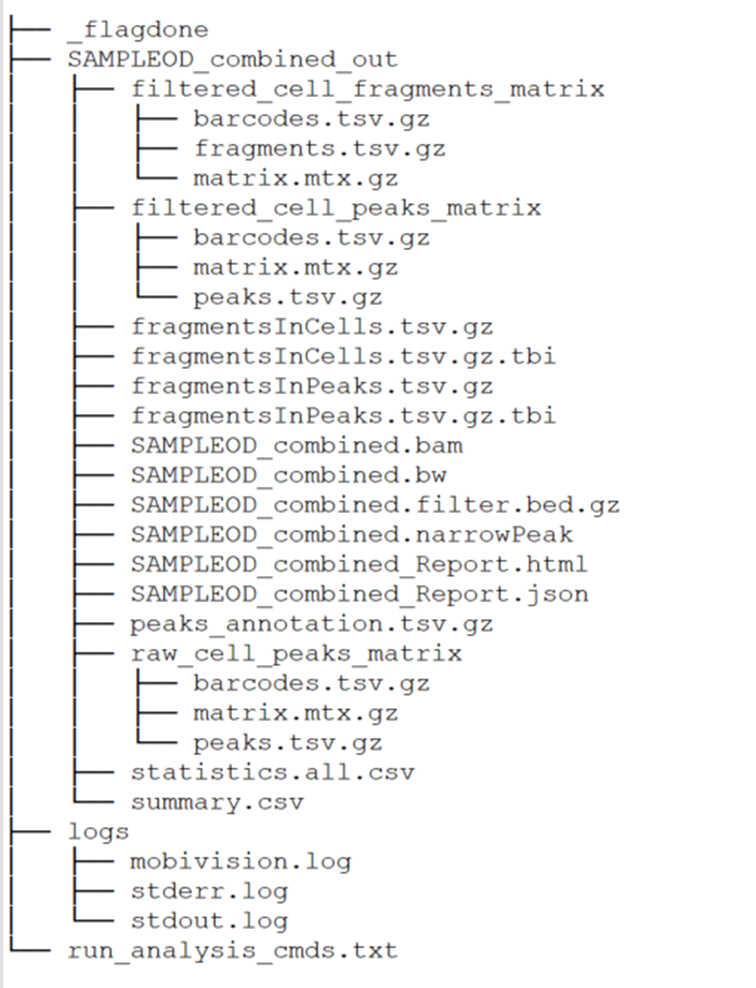
The default output files of MobiVision ATAC-seq analysis include a total of 27 files. Note that the SAMPLEID_out directory is automatically generated by the software and does not require user specification:
- _flagdone: Flag fileindicating successful completion of the analysis.
- logs: Directory containingrun logs.
- run_analysis_cmds.txt:Complete record of command-line instructions executed during the analysis.
- SAMPLEID_out: Root directoryfor all output files.
- filtered_cell_fragments_matrix:Root directory for the filtered cell-by-fragment count matrix.
- filtered_cell_peaks_matrix:Root directory for the filtered cell-by-peak count matrix.
- SAMPLEID.bam: Alignmentoutput file (BAM format).
- SAMPLEID.bw: Visualizationtrack file (BigWig format) for alignment results.
- SAMPLEID.filtered.bed.gz:Deduplicated and filtered fragment file (compressed BED format).
- SAMPLEID_Report.html: Qualitycontrol report in HTML format.
- SAMPLEID_Report.json: Qualitycontrol report in JSON format.
- summary.csv: Librarystatistics summary in CSV format.
- raw_cell_peaks_matrix: Rootdirectory for the unfiltered cell-by-peak count matrix.
- fragmentsInCells.tsv.gz:Filtered fragment file after cell selection (compressed TSV format).
- fragmentsInCells.tsv.gz.tbi:Index file for fragmentsInCells.tsv.gz.
- fragmentsInPeaks.tsv.gz:Fragment file overlapping peaks (compressed TSV format).
- fragmentsInPeaks.tsv.gz.tbi:Index file for fragmentsInPeaks.tsv.gz.
- SAMPLEID.narrowPeak/broadPeak:Peak calls for the entire library (in narrowPeak or broadPeak format).
- peaks_annotation.tsv.gz:Annotation information for detected peaks (compressed TSV format).
- statistics.all.csv:Comprehensive quality control metrics in CSV format.
Quality Control Report Interpretation
After the MobiVision ATAC analysis is completed, an HTML quality control report will be generated. The report is divided into six sections:
01 Overview
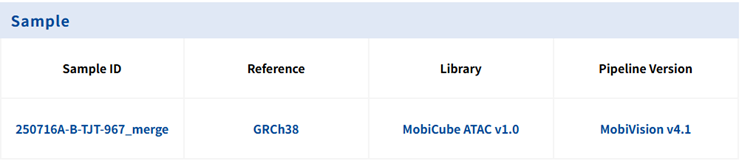
The Sample section includes the following information:
● Sample ID: Sample name
● Reference: Reference genome name
● Library: Library name
● Pipeline Version: Analysis pipeline version
02 Cells
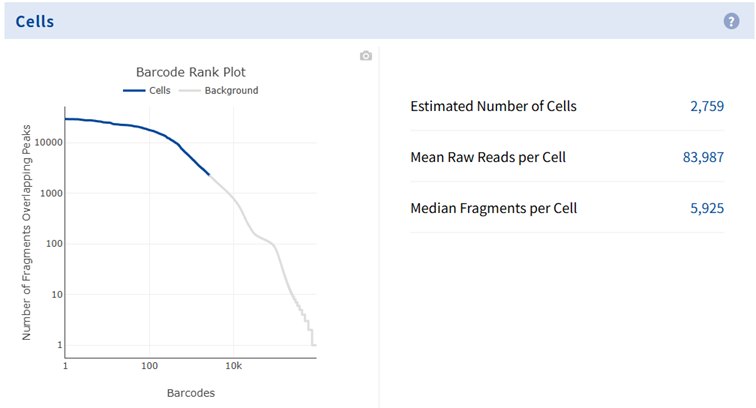
The "Cells" Section
The left panel displays the Barcode Rank Plot, while the right panel shows cell-related metrics, which are consistent with the content in the "Overview" section.
This plot is generated by:
1. Counting the number of valid fragments corresponding to eachcell barcode,
2. Sorting the cell barcodes in descending order based on theirvalid fragment counts (e.g., the cell barcode with the highest fragmentcount is assigned rank 1, and so on),
3. Using the cell barcode rank as the x-axis andthe number of valid fragments per cell barcode as they-axis.
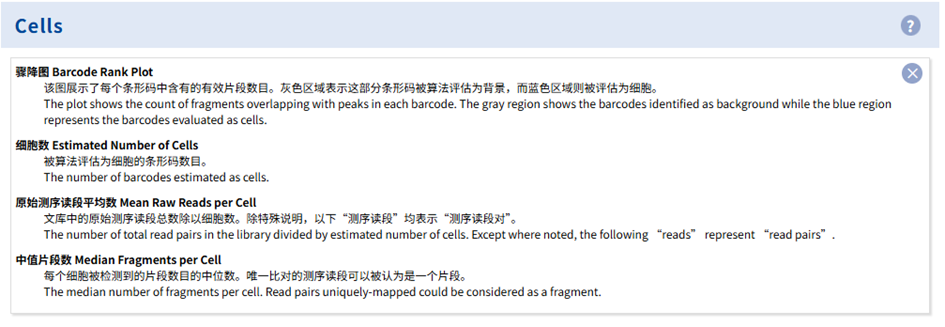
Users can click the question mark icon in the upper right corner of the section (also available in other sections) to access detailed help information, as shown below:
03 Mapping
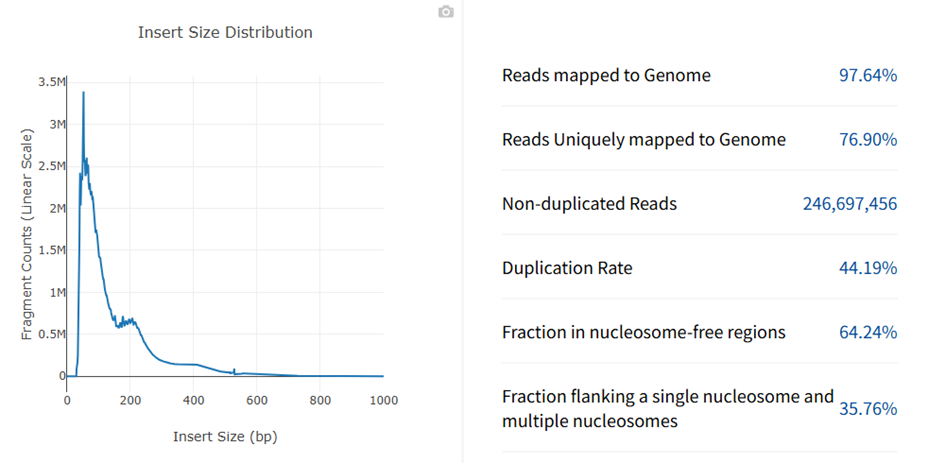
The Mapping Section
The left panel displays the Fragment Length Distribution Plot. The x-axis represents the length of fragments in the library, and the y-axis represents the number of fragments. This plot visually summarizes the distribution of DNA insert fragments of varying lengths.
The right panel shows mapping statistics of the library, including alignment-related metrics.
04 Targeting
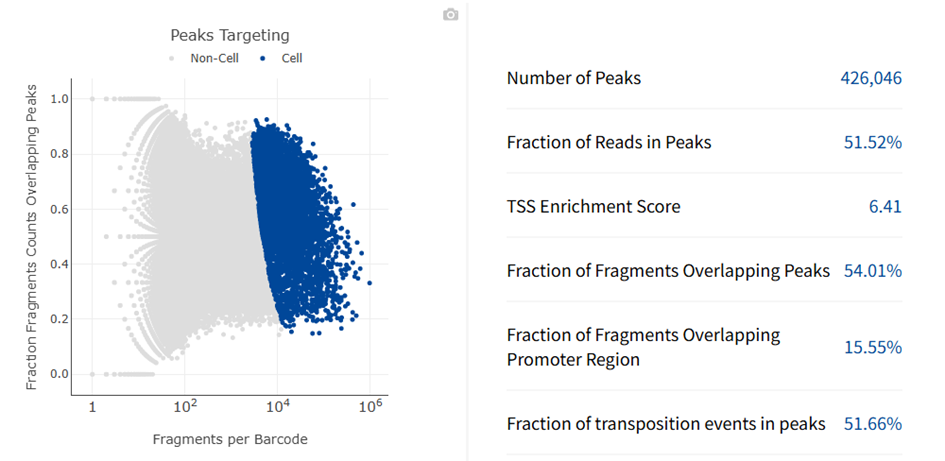
The Targeting Section
The left panel displays the Peaks Targeting Plot, where each point represents a cell barcode. The x-axis indicates the number of fragments per cell barcode, and the y-axis shows the percentage of fragments overlapping with peaks in each cell. Distinct colors are used to differentiate between 'Cells' and 'Non-cells'.
The right panel presents information about the peaks detected in the library.
05 Sequencing
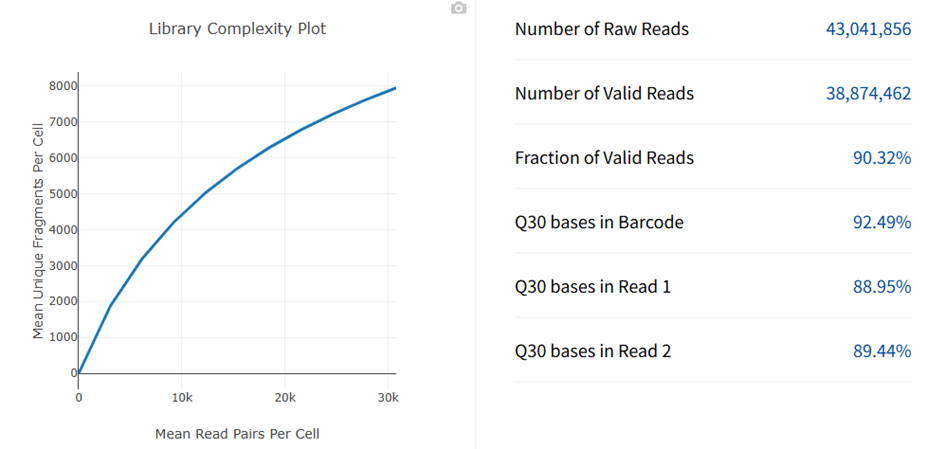
The Sequencing Section
The left panel displays the Library Complexity Plot, which illustrates the average number of fragments detected per cell across different sequencing depths (obtained through random down-sampling). When all fragments in the library have been captured, the number of fragments per cell no longer increases with further sequencing depth.
The right panel presents library information and results, including relevant sequencing metrics.
06 t-SNE Projection
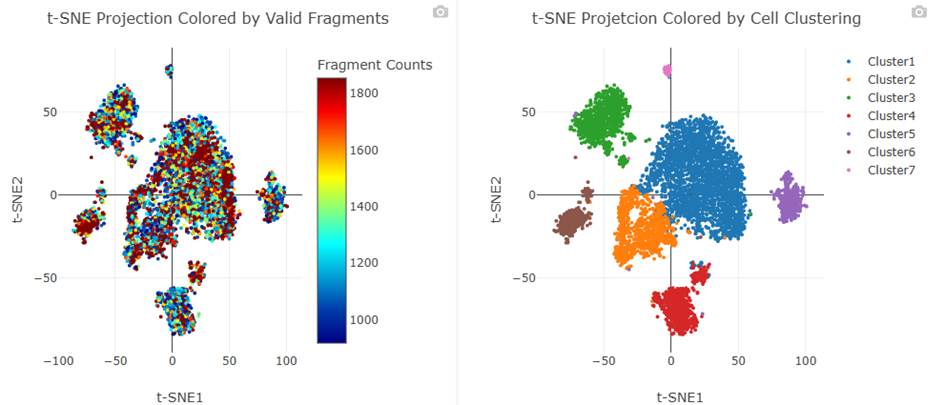
The t-SNE Projection Section
The left panel displays the t-SNE Plot of Valid Fragments, which visualizes the number of valid fragments per cell. The X and Y axes represent the two-dimensional embedding coordinates generated by the t-SNE algorithm. Each point corresponds to a cell?—?a higher number of valid fragments in a cell indicates stronger ATAC signal detection.
The right panel shows the Clustered t-SNE Plot, illustrating the distribution of cells based on clustering algorithms. Each point represents a cell, and points with similar colors indicate that the corresponding cells exhibit highly similar ATAC signal profiles.